SPECT and FDG-PET in neurodiagnostics: what brain metabolism and blood flow can make visible
A normal MRI tells you the structure is intact. It says nothing about metabolism. That is exactly where two nuclear medicine methods come in: FDG-PET measures how much glucose each brain region is using, and SPECT measures how well each region is supplied with blood. Both can give pointers when symptoms persist and every finding so far has been called “normal”. This article explains what the methods measure, how the examination runs, what abnormal patterns can indicate, where their limits lie and how a result feeds into the individual plan at our centre.
Last updated: 2026-09-13 · Medically reviewed by Dr. med. univ. Julian Douwes
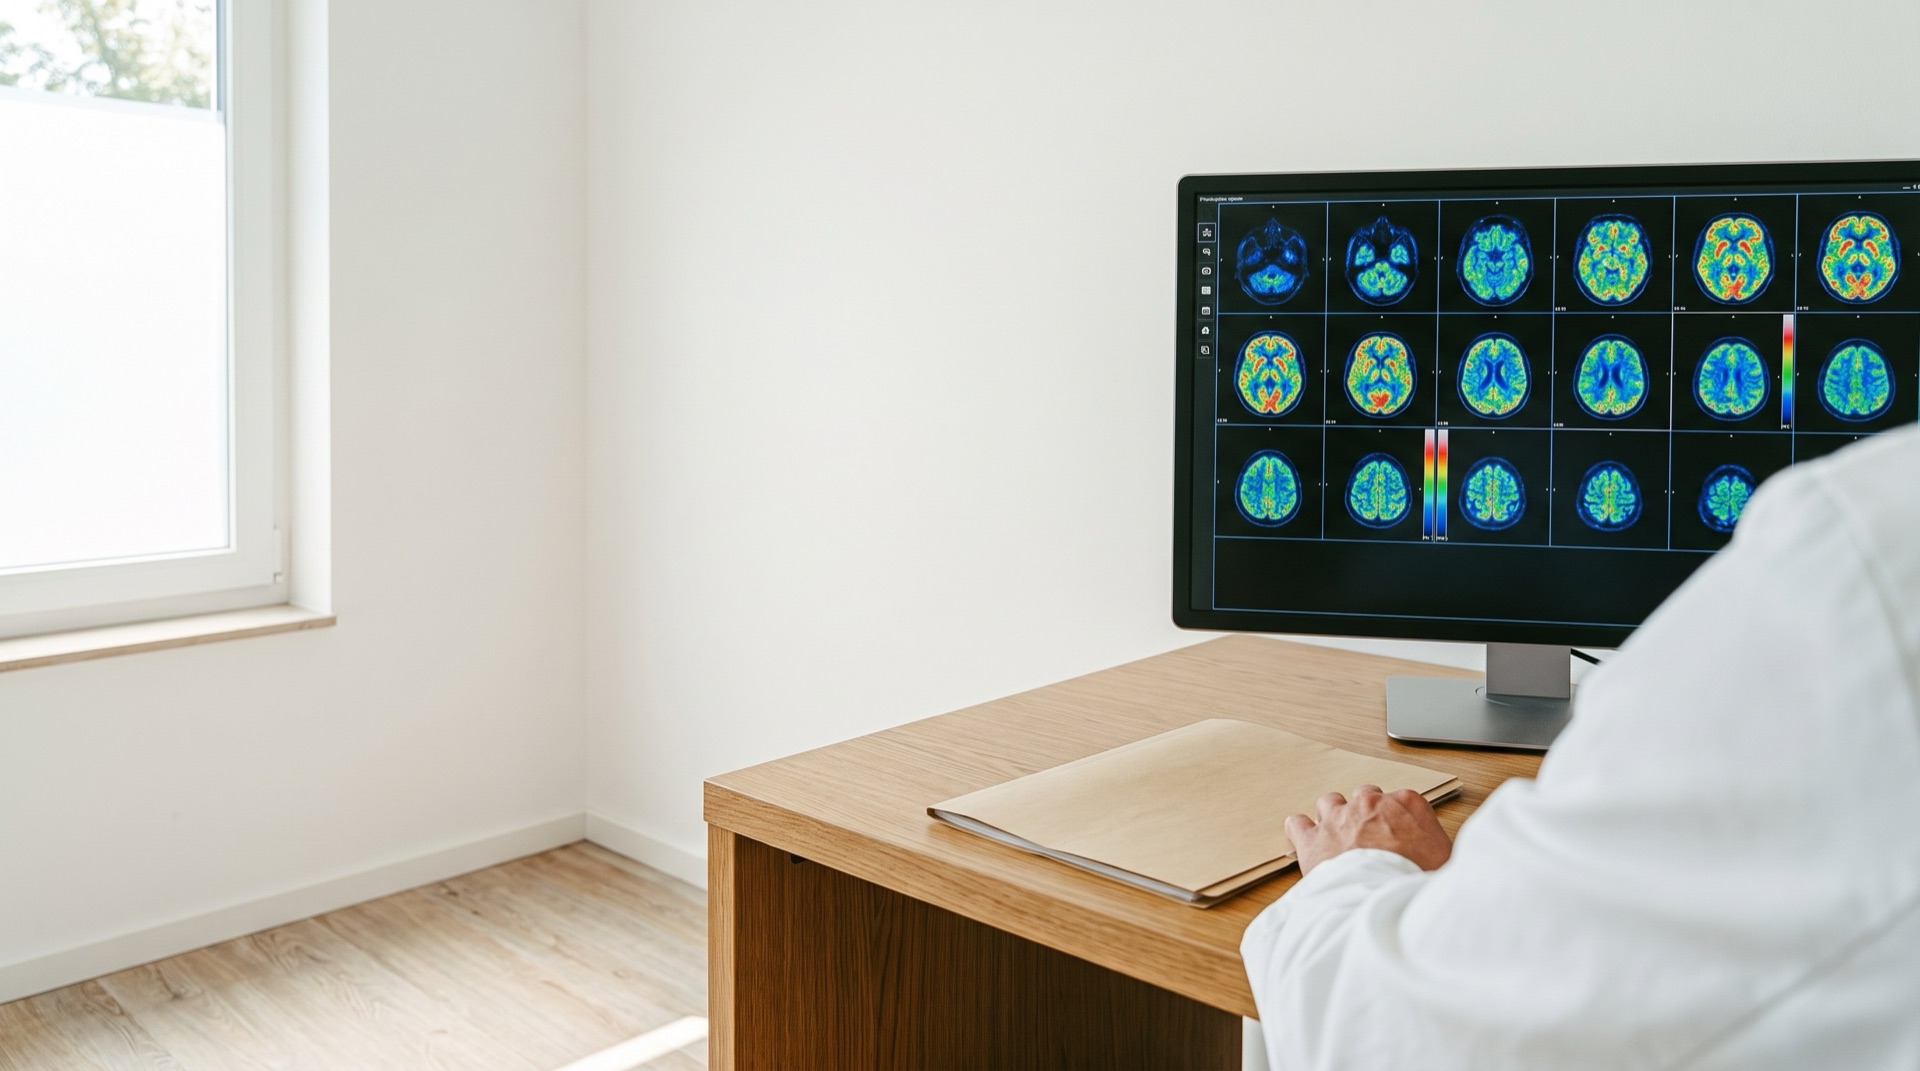
What FDG-PET and SPECT measure
Most people who come to us with Long COVID or ME/CFS have already heard this sentence: “The MRI is normal.” It is true, and it still does not answer the question you are asking. An MRI shows anatomy: volume, tissue, vessels, scars. Whether a region is currently working the way it should is not visible on it. For that you need a method that shows the brain at work.
FDG-PET (positron emission tomography with fluorodeoxyglucose) takes a detour through the brain’s energy budget. Nerve cells burn almost nothing but glucose, and most of that energy goes into signalling at the synapses. FDG is a glucose molecule carrying a weakly radioactive label. It is taken up where a lot of work is being done, and it stays trapped inside the cell. The camera then counts where the tracer sits and how much of it there is. The result is a map of regional glucose metabolism, and because that metabolism is tightly coupled to synaptic activity, the map is read as an approximation of how hard each network is working at rest.
SPECT (single photon emission computed tomography) measures something related from a different angle: regional blood flow. The perfusion tracer travels with the bloodstream, is fixed in brain tissue within minutes, and so records how well each region was supplied at the moment of injection. In a healthy brain, blood flow and metabolism are coupled: where nerve cells work harder, more blood flows. SPECT has a coarser resolution than PET but is more widely available. Both methods ask the same basic question: which regions are working less than expected, which are working more, and does that pattern fit your symptoms?
How the examination runs
For an FDG-PET you arrive fasting. Sugar in the blood competes with the tracer for uptake into the cells, which is why blood glucose is measured before the injection. The tracer is injected into an arm vein. Then comes the most important part, and it does not happen inside the scanner: a resting phase in a darkened, quiet room where you lie still, do not talk and do not read. During this time the tracer distributes itself according to your brain’s activity. What you do in those minutes shapes the picture. Only afterwards do you lie under the camera; the scan itself usually takes far less time than the resting phase.
With SPECT the sequence is similar, with one difference: the perfusion tracer is fixed in the tissue within minutes. The image therefore shows blood flow at the moment of injection, even if the scan is acquired later. Fasting is usually not required.
The radiation exposure of both methods is low and in the range of other nuclear medicine examinations; the tracers decay within hours, and drinking plenty speeds up clearance. Tell the team beforehand if you are pregnant or breastfeeding. Apart from the needle, you feel nothing of the examination. The sentence I give patients before they go: the picture is made during the resting phase, not inside the scanner.
What hypometabolism and hyperperfusion can indicate
The reading is a comparison. The reporting physician compares each region with the rest of the brain and with a normative database of healthy people of similar age, much as in a qEEG. A region with reduced glucose uptake is called hypometabolic, one with reduced blood flow hypoperfused. At first, both mean only this: less work is being done here than expected. The image does not say why. In studies, such a pattern is described with loss of nerve cells, with regions that have lost their input from other areas, with inflammatory processes, with disturbed energy supply and with functional down-regulation without any cell loss at all.
Increased metabolism or increased blood flow is rarer and usually easier to interpret: a region firing during a seizure lights up brightly on SPECT; an acutely inflamed area can appear overactive on FDG-PET; sometimes one network compensates for another.
What gets read is the pattern across several regions. In memory medicine, several of these patterns are well described: reduced metabolism in the posterior parietal and temporal regions and in the posterior cingulate is observed in Alzheimer’s disease, a frontally weighted pattern in frontotemporal dementias. A single dark spot is a pointer. A pattern is a question for the physician.
Where the limits lie
No PET and no SPECT makes a diagnosis on its own; the image only becomes readable in the context of history, clinical examination and laboratory work. The patterns are non-specific: reduced frontal metabolism is observed in depression just as in an early neurodegenerative disease, after an infection or under certain medications. Different conditions overlap in their maps, and the same condition looks different in two people.
On top of that, the resting state is not a fixed state. What you think about during the resting phase, how much you have slept, how tense you are, whether you take sedatives, antidepressants or other centrally acting drugs: all of it changes the image, sometimes markedly. High blood sugar lowers tracer uptake across the whole brain, which is why fasting is not a formality. And with age, metabolism in some regions declines anyway, which is why the normative database has to be age-matched.
For these reasons nobody orders a PET “just to have a look”. The examination is worth doing when a concrete question exists beforehand: does the pattern fit the suspected cause, or does it argue against it? A PET cannot answer a question nobody asked.
Where FDG-PET and SPECT are used: from Long COVID to memory disorders
The best established use is in cognitive disorders. When clinical examination and MRI leave open whether, and which, neurodegenerative disease lies behind a memory problem, FDG-PET is named in European recommendations as one building block of the work-up, because its patterns can help distinguish between causes. For a family that has been told “that is just age”, it is often the first examination that asks about function at all. More on the page MCI and cognitive decline.
In Long COVID, a French group led by Eric Guedj described in 2021, in the European Journal of Nuclear Medicine and Molecular Imaging, a pattern of reduced metabolism in a cohort of Long COVID patients, among other places in olfactory and frontal regions, the temporal lobe, the brainstem and the cerebellum. These are group findings; they do not prove a diagnosis in any individual, but they show that the symptoms can have a measurable correlate. In Long COVID the word “normal” often applies only to structure. What that means for treatment is on the page Long COVID and post-COVID and in the article Brain fog: what helps.
In ME/CFS, regional hypoperfusion has been described in older SPECT studies; the studies are small and inconsistent, and imaging here is research, not a routine step. It can still be useful when another cause needs to be ruled out. Our view of the condition: ME/CFS.
In neuroinflammatory processes, FDG-PET cuts both ways: it shows altered metabolic patterns, for instance in autoimmune encephalitis, but it does not show the inflammation itself. Tracers that make activated microglia directly visible exist, but so far they are research tools. In depression, studies describe changes in the metabolism of prefrontal and cingulate regions; imaging is not used to diagnose depression, but a reader has to know these changes to read an image correctly, because depression alters the pattern. And in unexplained neurological symptoms, where structure and lab work are normal and the symptoms remain, a functional image can reopen the question in either direction: it can show a correlate that fits the clinical picture, or it can make a suspected cause less likely. Both count as results.
How a result feeds into your plan with us
With us, every patient starts with a structured assessment: history, the findings you bring, questionnaires, clinical examination, and where needed lab work and imaging. Whether qEEG brain mapping is added is decided after that. An FDG-PET or SPECT is not routine. It comes into play when the assessment raises a question that only a metabolism or perfusion image can answer, and it is then carried out through cooperating nuclear medicine practices or hospitals. If you already have a PET or SPECT, bring the report and the images; we read them together with you.
The result is one building block among others, and its value shows only in combination. The qEEG shows the timing of the networks at millisecond resolution, the PET their energy use, both against a normative database. The lab work often explains why a pattern looks the way it does. One example we see often in Long COVID: a hypometabolic pattern after an infection is, for us, first a question for the immune system, the mitochondria and autonomic regulation, not only for the coil. An immune system running on permanent duty sends inflammatory messengers to the brain that change how networks fire; nerve cells whose energy production has stalled after an infection work less before any image shows it; and a vagus nerve that no longer switches into recovery keeps the state going. Whoever only stimulates the network in that situation is working against an engine that keeps running. That is why infection and inflammation work-up, mitochondrial markers and heart rate variability belong in the same plan as rTMS or taVNS. A second example: a frontally weighted pattern in an unrecognised underactive thyroid is a thyroid case first.
That is how an image becomes an order of steps. You get what the assessment suggests, not what happens to be available in the building. We track the course with the instruments that can be repeated without radiation: questionnaires, HRV and, where it was used, the qEEG. How the whole is built is shown in our program; the overview of our measurements is under Diagnostics.
The next step
If you or a relative have been told that all findings are normal, take one question to the next appointment with your neurologist: “Was my brain’s function measured, or only its structure?” The answer sorts out what has been examined so far and what has not. If you want to know whether a functional work-up is worthwhile for your symptoms, bring your existing findings to the free initial consultation. There we clarify which measurement asks the right question in your case.
Frequently asked questions
Is the radiation from an FDG-PET or SPECT dangerous?
Can a PET or SPECT prove Long COVID?
PET or SPECT: which is better?
Do I need to fast, and should I stop my medication?
Does the Douwes Brain Center perform PET and SPECT itself?
Read more
Similar articles
An article does not know your findings.
What fits you is shown by the structured assessment. The free consultation takes 15 to 20 minutes and clarifies whether this path is worth it for you.