What an MRI Can’t Show:
How Your Brain Works
Every patient starts with a structured assessment. When the question calls for it, qEEG brain mapping is added: it records your brain’s electrical activity on the 10-20 system and compares it against a normative database. About 60 minutes, painless, no radiation.
“All results normal” describes what was measured. Not what is missing.
You may know the sentence. Blood work fine, MRI clear, and still your head does not work the way it did two years ago. Both were the right tests, and both ask about substance and structure: is something missing in the blood, is something in the brain damaged or displaced? How your brain works, in what rhythm, how well its networks play together, is a third question. That is the question qEEG brain mapping asks. Whether it is added in your case is decided by the assessment, which is where every plan here begins; what follows is described in our method.
First the assessment — then, where needed, the qEEG
The qEEG is the focus of this page and never the first measurement. Before it comes the assessment every patient receives: history, existing findings, questionnaires, a clinical examination, and where needed lab work and imaging. Whether a qEEG is added is decided after that, not before. A physician reads all the layers together; your program grows out of that.
Imaging
Your MRI report belongs here, especially if it was unremarkable: it rules out structural causes and turns the attention to function.
Functional & neurological diagnostics
Heart rate variability shows whether your autonomic nervous system can still switch into recovery; the neurological examination checks circulation on standing and rules out focal causes.
Clinical assessments
Structured self- and observer ratings, plus the Brain Network Analysis and follow-up questionnaires: what you experience becomes comparable and measurable over time.
qEEG brain mapping
When the question calls for it: your brain’s electrical activity, recorded at 32 points and compared against a normative database. The focus of this page.
Lab analysis
Inflammatory, metabolic, hormonal and micronutrient values provide the physical context your brain is working in.
Your own brain rhythms — compared against the norm
An EEG records your brain’s own electrical activity, millisecond by millisecond. The quantitative EEG (qEEG, or brain mapping) calculates from that how strongly each rhythm is present at each measurement point, and compares the result with an age- and sex-matched normative database. What comes out is a map: it shows where your brain deviates from the typical range, and in which direction.
The grid every clinical EEG uses
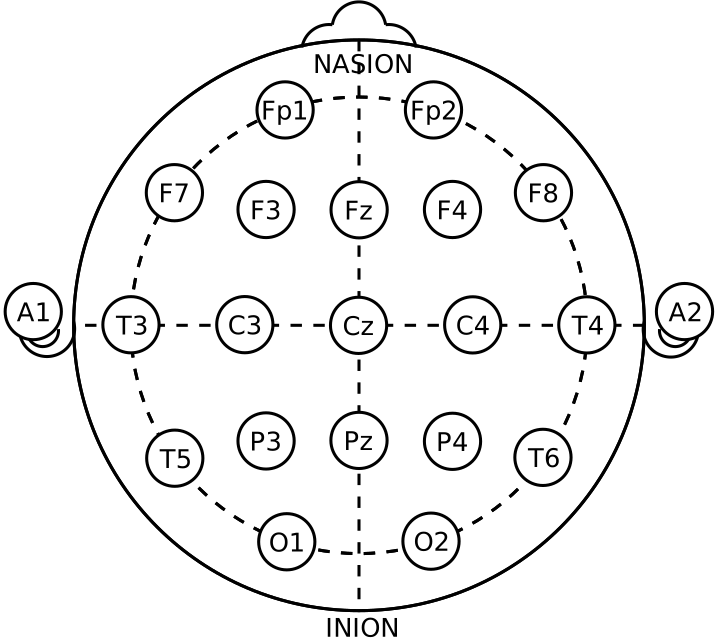
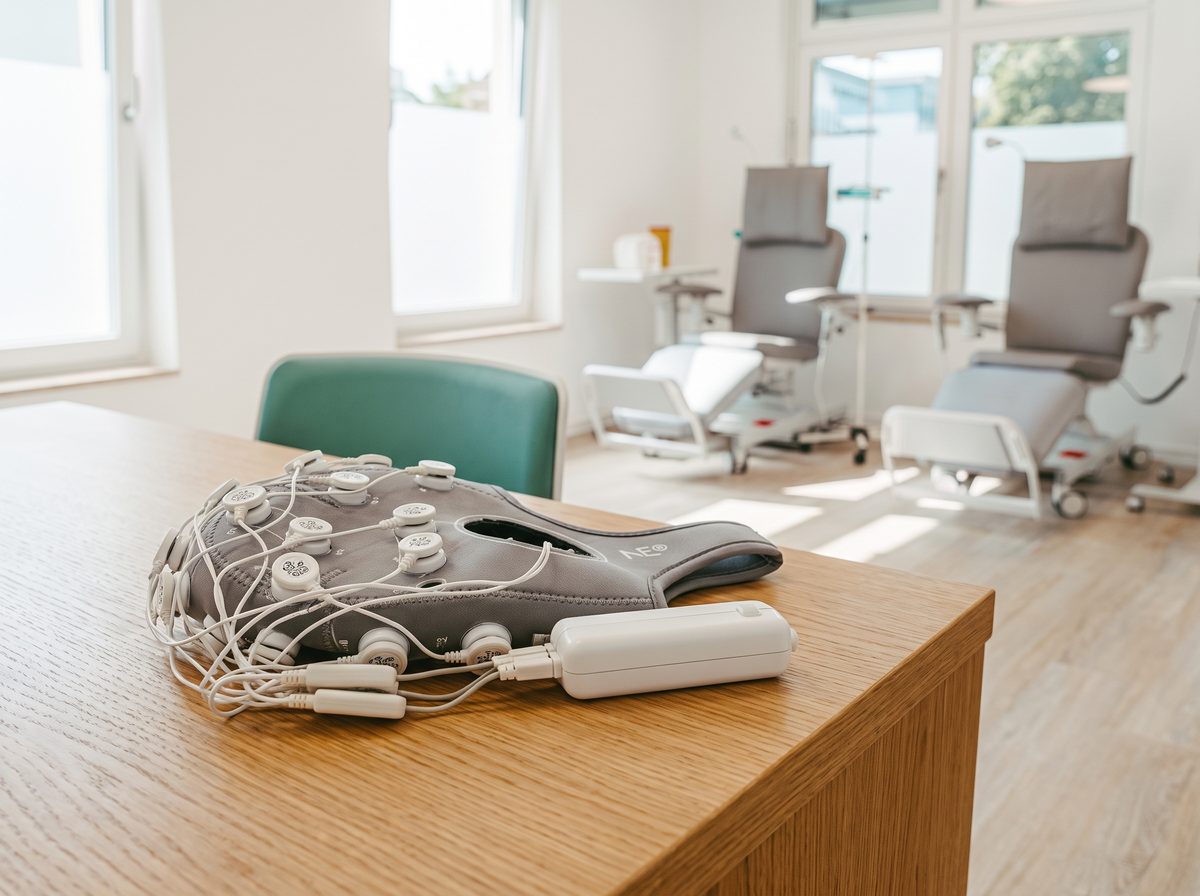
The sensors follow the international 10–20 system, the standard for electrode placement for decades: each measurement point sits at a fixed distance over a specific brain region, Fp1 over the left frontal lobe, O2 over the right visual cortex. That is what makes your recording comparable with the normative database, and later with your own. A soft cap holds the electrodes; a little conductive gel ensures contact. The sensors receive your brain rhythms; nothing is sent into the brain.
About 60 minutes — you sit, the cap listens
The actual recording typically takes around an hour. You sit quietly, breathe normally and let your thoughts wander; the device records what your brain does meanwhile.
- 1
You arrive
You arrive in Bad Aibling and we go through the steps together once. No fasting, no contrast agents, no preparation.
- 2
The cap goes on
The soft cap with 32 sensors is placed on your head and aligned to the 10–20 grid. A little contact gel at each point; it feels briefly cool, nothing more.
- 3
Recording, eyes open
You sit relaxed with your eyes open. The sensors read your brain rhythms. Nothing is sent in, nothing is stimulated.
- 4
Recording, eyes closed
A second segment with eyes closed. The resting state shows the baseline rhythm your brain runs on when it has nothing to do.
- 5
A short task (optional)
Depending on the question, a brief concentration or reading task. This lets us see whether the brain shifts up a gear when it is asked to.
- 6
Done, you go home
Cap off, the gel washes out. No after-effects, no downtime; you carry on with your day.
Non-invasive · painless · no downtime
Three levels — and you see your own map on the screen
Frequency bands Delta–Gamma
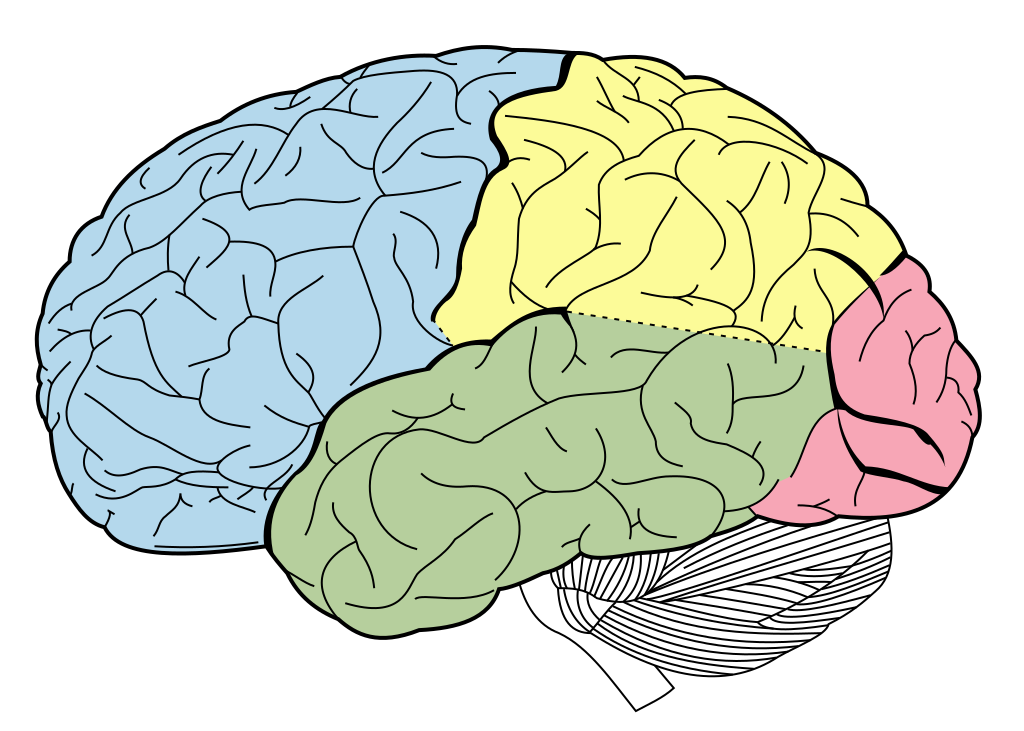
The classic EEG rhythms, from slow (Delta, Theta) to fast (Beta, Gamma). For each region, the map shows whether a rhythm is over-, under- or normally expressed.
Connectivity
How well distant regions stay in step. Networks can be too tightly or too loosely coupled; both show up in the interplay, never in a single region.
Comparison to a normative database
Your values against an age- and sex-matched reference. Whatever deviates becomes visible as a number, with direction and size, and can therefore be measured again later.
qEEG · Alpha 8–12 Hz · relative power
The map becomes a report — and a plan
The assessment, and the qEEG analysis if one was recorded, becomes a written findings report you can understand: what deviates from the reference range in your case, in the brain as in the body, and what that may mean in the context of your symptoms. From it we draw up your program with you, using procedures from our treatment portfolio that have the best evidence for your conditions. Every procedure carries its evidence level: Medicine, graded by evidence.
A physician reads the map — no computer decides.
The computer compares numbers. What those numbers mean for you, together with your history, your symptoms and your goals, is judged by a person. Here, a physician reads every map personally; responsibility rests with our Chief Medical Officer Dr. med. univ. Julian Douwes, within the Clinicum St. Georg.
A qEEG is diagnostics, not therapy, and it makes no diagnosis at the push of a button. It shows a deviation and its direction. What follows from that, we decide with you on that basis.

The measurement still missing from your file
In a free 15 to 20 minute consultation we work out whether qEEG brain mapping makes sense for your symptoms, what the appointment in Bad Aibling involves and what happens afterwards.